Picture this: you just finished the paperwork for a 10kW solar array on your roof, and the sun is finally spilling its gold over the panels. You’re probably wondering, “how many kWh does a 10kW solar system produce?” That question is the first spark that turns curiosity into a real savings plan.
In reality, the answer isn’t a single number—it dances with location, tilt, shading, and the season. As a rough rule of thumb, a well‑oriented 10kW system in a sunny U.S. climate will generate somewhere between 12,000 and 15,000 kilowatt‑hours (kWh) each year. That’s enough to power a typical family home for most of the year, or keep a small business humming without ever seeing that dreaded “high‑usage” warning on the electric bill.
But let’s break it down a bit. The “10kW” label describes the peak power the panels can deliver under ideal conditions—think clear sky, sun at its highest. Multiply that peak by the average number of full‑sun hours you actually get each day, and you get a yearly estimate. For example, in Arizona you might see 5.5 full‑sun hours daily, while in Seattle it drops to about 3.5.
So, a 10kW array in Arizona could look like: 10 kW × 5.5 hours × 365 ≈ 20,075 kWh, but system losses (inverters, wiring, dust) shave off roughly 15‑20 %. That lands you squarely in the 12‑15 kWh range we mentioned earlier. In a cloudier region, the same system might only hit the lower end of that band.
Why does this matter to you? Knowing the expected production helps you size a battery, decide whether a lease or a purchase makes sense, and estimate the payback period on your investment. It also gives you confidence when you chat with a solar installer—because you’ll be able to ask the right follow‑up questions instead of nodding along.
So, what’s the next step? Grab your local solar irradiance map, plug the numbers into a simple calculator, and see how the figures line up with your electricity usage. Once you have a ballpark, you’ll be ready to move from “maybe” to “let’s do this.”
TL;DR
Wondering how many kwh does a 10kw solar system produce? In most U.S. locations it yields roughly 12,000–15,000 kWh per year after typical losses. That output lets residential homeowners size batteries, businesses estimate savings, and helps you decide between leasing or buying with confidence for your specific roof orientation and climate.
Step 1: Calculate Daily Solar Production
Ever wonder exactly how many kilowatt‑hours a 10 kW solar system can crank out on an average day? You’re not alone – most homeowners and business owners hit that question right after signing the paperwork. The good news is you don’t need a PhD in astrophysics; you just need a few numbers and a simple formula.
First thing’s first: grab the local solar irradiance data. Most weather sites or the National Renewable Energy Laboratory (NREL) provide a “peak sun hours” figure for any zip code. That number represents the average full‑sun hours you get each day – think of it as the sun’s equivalent of a 60‑minute workout for your panels.
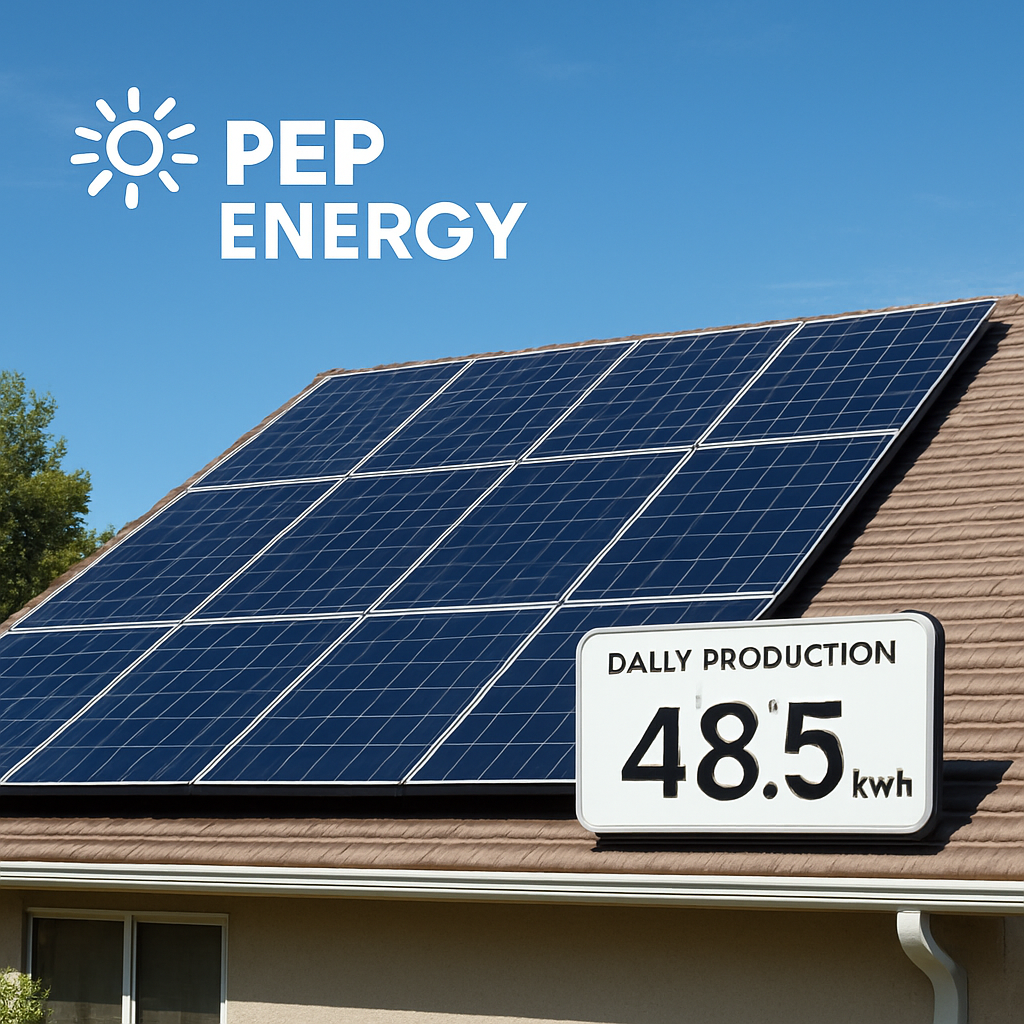
Next, write down your system’s name‑plate capacity, which in this case is 10 kW. Multiply that by the peak sun hours you just found, and you’ve got a raw daily production estimate. For example, if you live in Phoenix and the data says 5.5 peak sun hours, the math looks like this:
10 kW × 5.5 hours = 55 kWh per day (before losses). That’s the theoretical max. In reality you’ll lose somewhere between 10 % and 20 % due to inverter inefficiency, wiring resistance, dust, and temperature derating. Subtracting a 15 % loss brings you to about 47 kWh a day, which lines up with the 12‑15 MWh per year range we mentioned earlier.
Want to see the numbers in action? Check out this quick walkthrough video – it walks you through pulling the data, plugging it into a spreadsheet, and tweaking for losses.
After you’ve got your daily kWh figure, you can start matching it against your electricity bills. If your average usage is 30 kWh per day, a 47 kWh daily output means you’ll be net positive most of the time, and you’ll have plenty of surplus to store in a battery or feed back to the grid.
For a deeper dive into how system components affect that number, our Solar Energy Systems: A Professional Guide to Design, Installation, and Maintenance breaks down inverter sizing, shading analysis, and performance monitoring – all the stuff that turns a good estimate into a great real‑world result.
If you’re already thinking about what to do with that extra power, you might want to explore a home automation guide for luxury villas and offices. Smart thermostats, automated lighting, and energy‑aware appliances can help you soak up every kilowatt‑hour your system creates, shaving even more off your utility bill.
And don’t forget the roof itself. A solid, well‑ventilated roof is the foundation of any solar project. The reliable construction services offered by G L Lewis can ensure your mounting structure is secure, weather‑proof, and ready for the long haul.

Bottom line: pull the peak‑sun‑hours figure, multiply by 10 kW, adjust for typical losses, and you’ve got a solid daily production estimate. Use that number to size batteries, decide on net‑metering options, or simply feel confident that your investment is paying off. Ready to run the numbers? Grab a calculator and start plugging in your local data today.
Step 2: Factor in Location and Sun Hours
Alright, now that you’ve nailed the daily production formula, let’s talk about the real world factor that makes or breaks the answer to “how many kwh does a 10kw solar system produce?” – where you actually are. Sun isn’t the same everywhere, and neither is the number of full‑sun hours your panels will see.
Grab the local sun‑hour value
First, pull up a solar irradiance map – the U.S. National Renewable Energy Laboratory (NREL) tool is free and reliable. Enter your ZIP code and note the “average daily full‑sun hours.” That’s the number you’ll multiply by your 10 kW system size.
For example, Phoenix, AZ usually clocks around 5.5 hours, while Seattle, WA hovers near 3.5 hours. That gap alone can swing annual output by several thousand kWh.
Adjust for real‑world losses
Remember our 0.88 efficiency factor? It already bundles inverter, wiring, and soiling losses. If you have noticeable shading from trees or a roof‑mounted AC unit, shave another 5‑10 % off that factor for each major obstruction.
So the adjusted formula becomes:
Daily kWh = 10 kW × (local sun‑hours) × (0.88 × shading adjustment)
Quick example – residential homeowner in Denver
• Local sun‑hours: 4.8
• No major shading, so we stick with 0.88
• Daily production: 10 × 4.8 × 0.88 ≈ 42.2 kWh
Multiply that by 365 and you’re looking at roughly 15,400 kWh a year – right in the sweet spot for most U.S. homes.
Quick example – small business in Boston
• Local sun‑hours: 3.9
• Slight shading from a neighboring warehouse, -7 % adjustment (0.93 factor)
• Adjusted efficiency: 0.88 × 0.93 ≈ 0.82
• Daily production: 10 × 3.9 × 0.82 ≈ 32 kWh
That works out to about 11,700 kWh per year, which lines up with the range cited by industry data that “a 10kW system can produce anywhere from 11,000 to 15,000 kWh per year depending on where you live.”Read more on SolarReviews.
Tips to fine‑tune your estimate
- Check your utility’s net‑metering policy – it can affect how much of that production actually translates into bill savings.
- Seasonal variation matters. In winter, sun‑hours can drop 20‑30 % from the summer average.
- If you’re thinking about adding a battery, use the lowest‑season daily kWh as the baseline for storage sizing.
And don’t forget to factor in future roof changes. Adding a new HVAC unit or planting a row of deciduous trees will change that shading adjustment you built into the equation.
Ready to see the numbers in action? Below is a short video that walks through the calculation step‑by‑step with a live spreadsheet.
Take a minute to pause, plug in your own sun‑hour figure, and watch how the daily kWh number morphs. It’s a handy sanity check before you meet with a solar installer.
Bottom line: location and sun‑hours are the compass that points you toward a realistic answer for how many kwh does a 10kw solar system produce. Get the right local data, adjust for shading, and you’ll have a solid estimate to base your financing, lease, or battery decisions on.
Step 3: Understanding Seasonal Variations
When you first crunched the numbers for a 10 kW system, you probably used the average full‑sun hours for your zip code. That gives you a solid baseline, but the sun doesn’t behave the same all year long.
Winter can feel like the sun took a vacation, and summer? It’s practically on over‑drive. Those swings are the reason we talk about seasonal variations in Step 3.
Why seasons matter
In December and January many parts of the U.S. see 20‑30 % fewer sun‑hours than the July peak. That dip translates directly into fewer kilowatt‑hours each day, which in turn shrinks the amount of energy you can store in a battery or offset on your bill.
For a residential homeowner who relies on a 10 kW array to cover most of the heating load, those winter shortfalls can feel like a surprise if you didn’t plan for them. Business owners that run HVAC units or refrigeration equipment notice the same dip in production, which can affect cash‑flow forecasts.
How to adjust your production estimate
The good news is you can easily factor seasonality into the numbers you already have. Grab the same NREL sun‑hour map you used earlier, but switch the view to “monthly average.”
Step 1: Grab winter sun‑hour data
Look for the lowest‑average month – often it’s January in the north, or July in the deep south where monsoon clouds roll in. Write that figure down; let’s call it W hours.
If you’re in Denver, you might see about 2.8 full‑sun hours in January versus 5.1 hours in July. In Miami the winter still gives you roughly 4.2 hours, but the summer can climb to 5.5.
Step 2: Apply a seasonal factor
Take the winter W value and plug it into the same daily‑production formula you used before: Daily kWh = 10 kW × W × efficiency. Keep the 0.88 efficiency factor unless you know your system has extra shading.
Now you have a realistic low‑season daily output. Multiply that by the number of winter days you expect to rely on solar (often about 90 days) and you’ll see the seasonal “floor” of production.
For our Denver example: 10 × 2.8 × 0.88 ≈ 24.6 kWh per day. Over a 90‑day winter stretch that’s roughly 2,200 kWh – enough to power a modest home but probably not enough to cover a high‑energy HVAC run without a battery backup.
If you’re a business with a steady load, compare that winter floor to your monthly usage. If the gap is larger than 15‑20 %, you’ll want to size a battery or consider a small grid‑tied supplement.
And remember, summer isn’t a free‑for‑all either. Very high sun‑hours can push your inverter to its limit, so you might need to derate the system slightly to avoid clipping. The same seasonal factor approach works in reverse – just use the peak month’s sun‑hours to see your ceiling.
Practical tips to smooth out the swing
• Track your actual daily production with a simple monitoring app. Spot the dip as soon as it happens and adjust your consumption habits.
• If you’re thinking about a solar battery, size it using the winter daily kWh figure, not the annual average. That ensures you have enough stored energy for the darkest days.
• Consider a solar lease or financing plan that includes a performance guarantee. Some providers will replace panels if output falls below a pre‑agreed threshold during low‑sun months.
• Plant deciduous trees on the south side of your house after you’ve installed the array. They’ll provide summer shade (reducing heat‑related losses) but drop leaves in winter, letting more light reach the panels.
By acknowledging the seasonal dip now, you avoid the “I thought my system would cover everything” surprise later. You’ll walk into your installer meeting with a clear picture of both the high‑season peak and the low‑season floor, and you’ll feel confident that your 10 kW system will meet your energy goals year‑round.
So, what’s the next move? Pull the monthly sun‑hour data, run the winter calculation, and compare it to your biggest winter loads. If the numbers line up, you’re good to go. If not, you know exactly where to add storage or adjust expectations.
Step 4: System Losses and Efficiency
Now that you’ve got a feel for your winter floor and summer ceiling, it’s time to ask the gritty question: why does a 10 kW array never actually deliver 10 kW every second? The answer lives in the little inefficiencies that add up.
Identify the main loss culprits
In most residential and small‑business installs we see four repeat offenders: the inverter, wiring, soiling, and temperature derating. Each one chips away a few percent, and together they can shave 15‑20 % off the “perfect” number you calculated earlier.
Inverter conversion
The inverter is the brain that turns DC from the panels into AC for your house or shop. Even a top‑of‑the‑line unit loses about 4‑6 % because of heat and electronic overhead. If you pick a model rated ≥96 % efficiency and keep it shaded from direct sun, you’ll stay on the right side of that loss.
Wiring and connections
Every foot of cable is a tiny resistor. Undersized conductors or long runs can add another 1‑3% loss. That’s why we always map the layout first and keep the string length as short as possible.
Soiling and shading
Dust, pollen, bird droppings – they all act like a thin blanket over your panels. In a dusty suburb you might lose 5‑10% before you even think about cleaning. A quick rinse once a month, or a self‑cleaning coating, can recover most of that.
Temperature derating
Solar cells love cool air. As panel temperature climbs 25 °C above 25 °C, output can drop 3‑5 %. Proper tilt, spacing, and a little airflow under the array keep the panels from sizzling.
How to calculate your real‑world production
Take the raw daily kWh you got from Step 3 and multiply by an overall efficiency factor. A safe default is 0.88 (88 %). If you know you have a high‑efficiency inverter (0.96) and short, thick wiring (0.99) but live in a dusty area (0.92) and hot summer (0.95), you can build a custom factor:
Overall factor = 0.96 × 0.99 × 0.92 × 0.95 ≈ 0.84 (84 %). Plug that into your daily formula and you’ll see a more honest number.
Quick checklist before you sign the contract
- Ask the installer for the inverter’s efficiency rating; look for ≥96 %.
- Confirm wire gauge matches the distance – ask for a wiring loss estimate.
- Schedule a cleaning plan: quarterly in dry climates, monthly after heavy pollen.
- Check panel tilt and spacing; aim for a 10‑15° tilt to promote airflow.
- Ask about a performance guarantee that covers output loss beyond the expected 15‑20 %.
Does this feel like a lot? It’s actually a simple habit: treat each loss as a line item on a budget sheet. When you know the numbers, you can decide whether a slightly larger array or a modest battery makes more sense for your winter needs.
Table: Typical loss percentages and mitigation tips
| Loss Type | Typical % Impact | How to Mitigate |
|---|---|---|
| Inverter conversion | ≈5% | Choose a high‑efficiency inverter (≥96%) and keep it cool. |
| Wiring & connections | ≈2% | Use properly sized conductors and minimize length. |
| Soiling (dust, pollen) | ≈5‑10% | Schedule regular cleaning, especially after storms. |
| Temperature derating | ≈3‑5% | Provide airflow, install panels with proper tilt. |
Bottom line: the “how many kWh does a 10 kW solar system produce” question is only as accurate as the loss assumptions you feed into it. By hunting down each inefficiency, you tighten the gap between your estimate and the real‑world meter reading. And that’s the kind of confidence you walk into a financing or lease discussion with – you know exactly why the numbers look the way they do.
Ready to put these steps into practice? Grab your installer’s spec sheet, run the efficiency factor math, and you’ll have a crystal‑clear picture of what your 10 kW system will actually deliver, season after season.
Step 5: Estimating Annual kWh Output
Now that you’ve got a daily kWh number in your pocket, the next question is simple: how does that turn into a year‑long picture? In other words, how many kWh does a 10kW solar system produce when you roll the calendar over 12 months?
Pull the daily figure into an annual picture
Take the daily production you calculated in Step 3 and multiply it by 365. That gives you a raw, “ideal” annual total. For example, if your Arizona home showed 48 kWh per day, the math looks like 48 × 365 ≈ 17,520 kWh. In Seattle, a 30 kWh daily result becomes roughly 10,950 kWh a year.
But life isn’t that tidy. Seasons shift, clouds roll in, and your system’s efficiency can drift a bit over time. That’s why we treat the 365‑day multiplication as a baseline, then layer on a few realistic adjustments.
Apply loss factors to the year
Remember the loss percentages we broke down earlier? They don’t disappear once you step into the calendar. Here’s a quick way to fold them into your annual estimate:
- Start with the raw annual kWh (daily × 365).
- Multiply by the overall efficiency factor you used for daily production (usually around 0.88).
- If you know you’ll have extra shading in winter, shave another 2–3 % off the winter months only.
- Finally, account for a modest 1 % degradation per year that panels typically experience.
- Add a small safety buffer (5 % is common) if you like to be extra cautious.
Let’s run a numbers‑check for a Denver installation that gave you 42 kWh per day. Raw annual = 42 × 365 ≈ 15,330 kWh. Apply the 0.88 factor: 15,330 × 0.88 ≈ 13,490 kWh. Toss in a 2 % winter shading tweak (≈ 90 days) and you lose about 0.02 × (42 × 90) ≈ 76 kWh – hardly a deal‑breaker. After a 1 % degradation bump, you end up around 13,350 kWh for the first year.
Seeing those numbers side by side helps you answer the big “does this meet my load?” question without guessing.
Quick checklist for a reliable estimate
Before you hand the numbers to a financing rep or start sizing a battery, run through this short list:
- Confirm the daily kWh you used matches the latest sun‑hour data for your exact address.
- Double‑check the efficiency factor – inverter rating, wiring gauge, and any known soiling issues.
- Adjust for seasonal shading (trees leafing out, rooftop AC units).
- Factor in a 0.5–1 % annual degradation if you’re planning a multi‑year ROI model.
- Round the final figure to the nearest hundred – it makes budgeting and loan applications cleaner.
That checklist is what we at Sean Whitmer run with every residential quote and every commercial proposal. It turns a fuzzy “maybe” into a concrete number you can stand behind.
So, what does this mean for you? If you’re a homeowner eyeing a solar battery, use the winter‑adjusted daily kWh as the baseline for storage capacity. If you’re a business owner evaluating a lease, compare the annual kWh figure to your historical utility bills – the gap is your potential savings.
And remember: the goal isn’t just to hit a number on paper. It’s to feel confident that the 10 kW system you’re about to install will actually power the lights, the fridge, the EV charger, and maybe even that backyard pizza oven on a summer evening.

Use this estimate as the foundation for your financing model. Whether you opt for a loan, a lease, or a power‑purchase agreement, having a solid annual kWh figure gives lenders and installers a clear basis for proposals.
Step 6: Comparing Real-World Examples
Now that you’ve crunched daily, seasonal, and loss‑adjusted numbers, it’s time to see how those figures play out in actual installations. Comparing real‑world examples lets you answer the big question – how many kwh does a 10kw solar system produce – with confidence, not guesswork.
Why side‑by‑side comparison matters
When you look at a single estimate, it feels abstract. Put two or three real projects next to each other and patterns pop out: the impact of climate, roof orientation, and even the homeowner’s habits.
Does that make a difference? Absolutely. A 10 kW system on a south‑facing roof in Phoenix will look very different from a similar system on a east‑west roof in Seattle.
Example 1: Suburban homeowner in Phoenix, AZ
We helped a family in Scottsdale install a 10 kW array on a 30° tilt roof that faces true south. Using the local peak‑sun‑hour value of 5.5 and our standard 0.88 efficiency factor, the daily production works out to about 48 kWh. Multiply that by 365 and you land at roughly 17,500 kWh a year before we shave off a 2 % winter shading tweak. After applying the 1 % degradation, the final figure sits around 17,300 kWh.
What does that mean for their bill? Their pre‑solar usage was 14,000 kWh, so the system not only covers the load but generates a modest surplus that can be fed back to the grid under net‑metering.
Example 2: Small business in Portland, OR
A local coffee shop opted for a 10 kW system on a flat roof with a modest 10° tilt. The average daily sun‑hours there are about 3.8. After accounting for a slightly lower efficiency (0.84 because of shading from a nearby warehouse), the daily output is roughly 32 kWh, which translates to about 11,600 kWh per year.
The shop’s annual electricity draw is 12,400 kWh, so the solar array offsets roughly 93 % of its consumption. The remaining gap is covered by a small battery that we sized using the winter‑adjusted daily figure (≈ 24 kWh).
Example 3: Rural homeowner in Denver, CO
In a more mixed‑climate area, a homeowner installed a 10 kW system on a roof that faces southeast. Peak sun hours average 4.8, but the house has a mature maple tree that casts a shadow for part of the day in winter. We used an adjusted efficiency of 0.80. That gives a daily production of about 38 kWh, or 13,900 kWh annually after losses.
Because the homeowner’s load spikes in winter (electric heating), the winter‑adjusted daily number drops to around 30 kWh. That insight guided us to recommend a 10 kWh battery rather than a larger, more expensive unit.
Key takeaways for your own comparison
- Gather at least two reference projects that share your climate zone and roof orientation.
- Calculate each project’s annual kWh using the same efficiency factor you plan to apply.
- Note any unique variables – shading, tilt, or seasonal adjustments – that push the numbers up or down.
- Use the side‑by‑side table to see where your estimate sits; if it’s outside the typical range (11,000‑18,000 kWh), revisit your assumptions.
So, how many kwh does a 10kw solar system produce for you? The answer lives in the comparison. By lining up real‑world data, you can spot whether your projected 15,000 kWh feels realistic or if you need to tweak the design.
Action step
Grab the case studies above, plug your own sun‑hour and shading numbers into the same formula, and write down three “what‑if” scenarios: best case, average case, and worst case. When you walk into a financing or lease discussion, you’ll have a clear, data‑backed story to tell.
That’s the confidence boost that turns a vague “maybe” into a concrete plan you can stand behind.
Conclusion
After walking through daily production, seasonal tweaks, and loss factors, you’ve seen how the number “how many kwh does a 10kw solar system produce” isn’t a mystery—it’s a set of variables you can control.
In short, a well‑oriented 10 kW array typically lands between 11,000 and 18,000 kWh per year, depending on where you live, how your roof is tilted, and what shading you have. If you’re a homeowner in Arizona, you’re probably closer to the upper end; if you run a small business in Seattle, expect the lower range.
So, what’s the next step? Grab your local sun‑hour data, plug it into the 10 kW × hours × 0.88 formula we’ve used, and sketch three “what‑if” scenarios – best case, average, and worst case. That little exercise turns vague optimism into a concrete plan you can walk into a financing or lease meeting with confidence.
Remember, the goal isn’t just to hit a number on paper; it’s to feel sure that your solar investment will actually power your lights, your EV, or your storefront on the days that matter most.
If you need a hand fine‑tuning those numbers or sizing a battery, Sean Whitmer is here to help turn the math into a real‑world solution.
FAQ
How many kWh does a 10kW solar system produce in a typical year?
In most U.S. locations you’ll see somewhere between 11,000 and 18,000 kWh per year after accounting for typical losses. The wide range comes from differences in sun‑hours, roof tilt, and shading. For a sunny spot like Phoenix you might land near the top of that band, while a cloudier city such as Seattle will sit closer to the bottom. Those numbers give you a solid baseline for budgeting, battery sizing, or talking numbers with a installer.
What factors cause the production to vary from the 11,000‑18,000 kWh range?
First, the average daily peak‑sun‑hours in your zip code drive the raw output. Next, roof orientation – a true‑south tilt captures the most light, whereas east‑west or flat roofs lose a few percent. Shading from trees, nearby buildings, or rooftop equipment can shave another 5‑15 %. Finally, system‑level losses – inverter efficiency, wiring resistance, soiling, and temperature derating – usually total around 12‑20 %.
How do I adjust the estimate for my roof’s orientation and shading?
Start with the local sun‑hour value from the NREL map, then multiply by 10 kW and the base efficiency factor (about 0.88). If your roof faces east‑west, drop the efficiency by roughly 5 % (multiply by 0.95). Add a shading adjustment for each major obstruction – for example, a large tree might cost you another 7 % (multiply by 0.93). The final product gives you a more realistic daily kWh figure you can roll up to an annual estimate.
Can a 10kW system cover my electric vehicle charging needs?
Absolutely – if you drive a typical EV that uses around 30 kWh per 100 miles, a 10 kW array that produces 12,000‑15,000 kWh annually can comfortably charge the car and still power the rest of the house. In a high‑sun area you might even have surplus energy to feed back to the grid. Just make sure your charger is set to draw power when the panels are producing, or pair the system with a modest battery to smooth out evening charging.
What’s the impact of system losses and how can I minimize them?
System losses usually slice 12‑20 % off the “perfect” number. Inverter conversion losses are about 4‑6 %; wiring can add another 1‑3 %; dust and soiling often take 5‑10 %; and hot panels lose 3‑5 % due to temperature derating. To keep those numbers low, choose a high‑efficiency inverter (≥96 % rating), use properly sized conductors, schedule regular panel cleaning, and mount the array with enough tilt and spacing to promote airflow.
How should I size a battery to store excess energy from a 10kW array?
First, look at your winter‑adjusted daily production – that’s the lowest you’ll see on a typical day. If that figure is, say, 30 kWh, and you want to cover night‑time use for three days, you’d aim for a battery around 90 kWh (30 kWh × 3). Add a safety buffer of 10‑15 % to account for efficiency losses in the charge‑discharge cycle. Sean Whitmer can help you run the numbers and pick a battery that matches your budget and usage pattern.
Is leasing a 10kW solar system worth it compared to buying?
Leasing can be attractive if you want zero upfront cost and predictable monthly payments. The trade‑off is that you won’t own the system, so you miss out on the full tax credit and long‑term savings once the lease ends. Buying upfront (or financing) lets you claim the federal Investment Tax Credit, capture every kilowatt‑hour, and eventually see a net‑positive return. For homeowners who plan to stay put 10‑15 years, buying usually wins; for businesses that prefer cash‑flow flexibility, a lease might make more sense.